
Brett Boadway—Chief Operating Officer, IBAO
Understanding the impacts of the pandemic on our industry is always a topic guaranteed to pique member curiosity. Certainly, the past two years could have been times of mass disruption. Consumers with more time on their hands could have considered alternative options to place their business and financial worries could have prompted more shopping activity. While it’s possible that greater amounts of churn took place, at the aggregate level, IBAO isn’t seeing dramatic changes with respect to broker distribution market share in Ontario. Now that the 2021 financial statements have been published by the insurers in Ontario, I’m pleased to discuss the broker market share numbers from IBAO’s vantage point.
IBAO requests quarterly market share reports from MSA Research, assessing market share by distribution type. It’s based on insurers’ direct written premiums in Ontario, filtered by insurer distribution strategies. Results should be treated as estimates, as some insurers file their financial results as a single company despite distributing direct and through brokers (CAA Insurance is an example—this report features them as direct only). Some insurers with multiple distribution strategies file their financial results separately (Intact Insurance/Belair Direct is an example). And not all mutual insurers share their financial results with MSA and therefore aren’t included in this report.
“The insurance industry in Ontario is rich in competition and complex in its product and carrier options. Ontario brokers have done a wonderful job at delivering value and maintaining a foothold in the distribution landscape.”

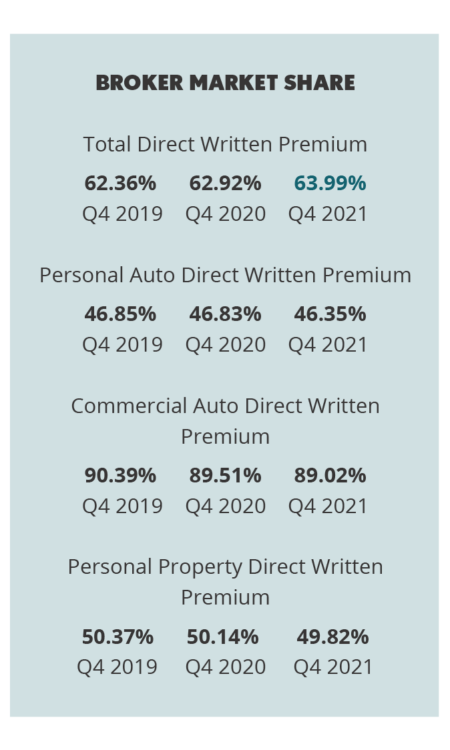
Broker Market Share Growing Year Over Year
When you look at specific lines of business (Personal Auto, Commercial Auto, Personal Property), 2021 numbers are slightly lower than 2020. But total direct written premium lines indicate that overall, broker market share increased slightly last year. This suggests that some or all of the lines of business that aren’t included in MSA’s report (Commercial Property, Commercial Liability, Commercial Specialty like Surety, Marine, etc.) were higher in 2021 versus 2020 to balance the average. This makes overall broker market share based on direct written premium in 2021 higher than the year prior.
Ontario Brokers Continue to Dominate Commercial Lines Distribution
In Ontario, there are over 120 insurers underwriting commercial business across the province. The top 10 commercial underwriters in Ontario represent 60% of the total market. Cooperators is the only insurer on that top 10 list that is not broker distribution based. Overall, approximately 95% of all commercial insurance products continue to be distributed through brokers, a line that brokers have continued to hold steady year over year.
Data Driven Planning for Future
Sharing the data depicting the current state of the broker distribution channel in Ontario may be helpful in formulating strategies for your own brokerage planning. The insurance industry in Ontario is rich in competition and complex in its product and carrier options. Ontario brokers have done a wonderful job at delivering value and maintaining a foothold in the distribution landscape. Let’s keep it up and grow it more.

